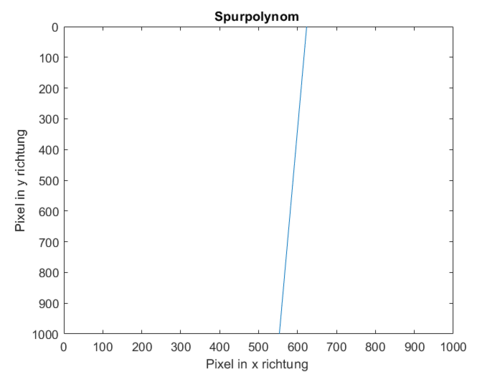
Spurpolynom Plotten
Zur Navigation springen
Zur Suche springen
Autor: Lukas Honerlage
Einleitung
Die Seite zeigt, wie ein Spurpolynom in Matlab berechnet werden kann.
Spurpolynom Herleitung
Wissenschaftlicher Hintergrund
Berechnung in Matlab

a = 1.20132e-07
b = -0.0701924
c = 623.378
X =[0:1:1000];
Y =[0:1:1000];
plot(a*X.^2 + b*X + c,Y)
axis([0 1000 0 1000])
title('Spurpolynom ')
xlabel('Pixel in x richtung ')
ylabel('Pixel in y richtung')
set(gca,'YDir','reverse');