Jetracer Lidar: Unterschied zwischen den Versionen
Zur Navigation springen
Zur Suche springen
| Zeile 10: | Zeile 10: | ||
== '''Daten in RVIZ einsehen''' == | == '''Daten in RVIZ einsehen''' == | ||
* | *Die Radar Daten könne im Rviz Programm eingesehen werden. Dafür müssen sie zuerst den folgenden Befehl eingeben. | ||
rosrun rviz rviz | rosrun rviz rviz | ||
[[Datei:JetRacer_Lidar_Rviz_Step01.png|Step01]] | [[Datei:JetRacer_Lidar_Rviz_Step01.png|Step01]] | ||
* | *Klicken Sie auf „Add“, um die Komponente LaserScan hinzuzufügen, wählen Sie das Thema /scan für das Thema und Laser_frame für den festen Rahmen, um die Radardaten zu sehen. Die roten Punkte im Bild sind die vom Radar gescannten Punkte. | ||
[[Datei:JetRacer_Lidar_Rviz_Step02.png|Step02]] | [[Datei:JetRacer_Lidar_Rviz_Step02.png|Step02]] | ||
* | *Klicken sie auf "Add" um dann die TF Komponente hinzuzufügen. | ||
[[Datei:JetRacer_Lidar_Rviz_Step03.png|Step03]] | [[Datei:JetRacer_Lidar_Rviz_Step03.png|Step03]] | ||
*TF | *TF zeigt zwei Koordinaten an, wobei base_footprint die Fahrgestellkoordinaten des Roboters sind und laser_frame die Radarkoordinaten. Die Radarkoordinaten und die Fahrgestellkoordinaten sind entgegengesetzt. | ||
[[Datei:JetRacer_Lidar_Rviz_Step04.png|Step04]] | [[Datei:JetRacer_Lidar_Rviz_Step04.png|Step04]] | ||
Version vom 11. Dezember 2024, 17:46 Uhr
LIDAR Node einschalten
- Der Lidar sollte wenn er korrekt angeschlossen ist beim Hochfahren des Roboters beginnen zu rotieren. Wenn das der Fall ist können die folgenden Schritte durchgeführt werden.
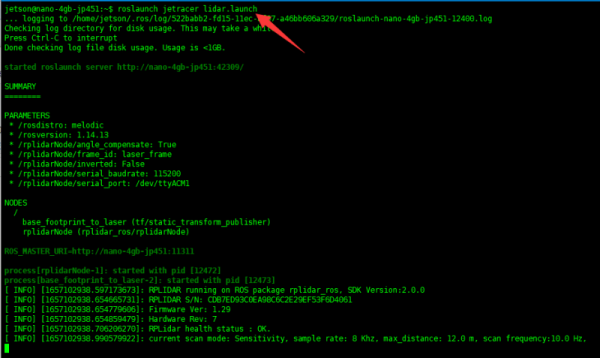
- Führen Sie den folgenden Befehl aus, um den Lidar-Knoten auf dem Roboter zu aktivieren.
roslaunch jetracer lidar.launch
- Wenn der Knoten nicht aktiviert werden kann, drücken Sie bitte die RESET-Taste auf dem "Expansion Board" und starten Sie es neu.
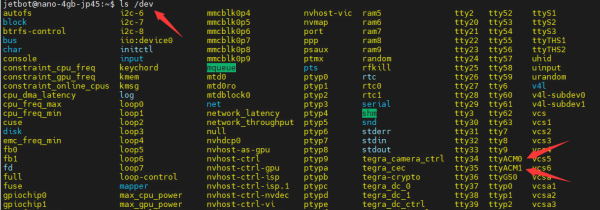
- Wenn Sie Is/dev ausführen, können sie überprüfen, ob das "Expansion Board" mit dem Jetson Nano verbunden ist und ob die Geräte ttyACM0 und ttyACM11 gefunden wurden. (ttyACM0 ist für die Kommunikation mit dem Mikrocontroller und ttyACM1 ist für die Lidar-Kommunikation).
ls /dev
Daten in RVIZ einsehen
- Die Radar Daten könne im Rviz Programm eingesehen werden. Dafür müssen sie zuerst den folgenden Befehl eingeben.
rosrun rviz rviz
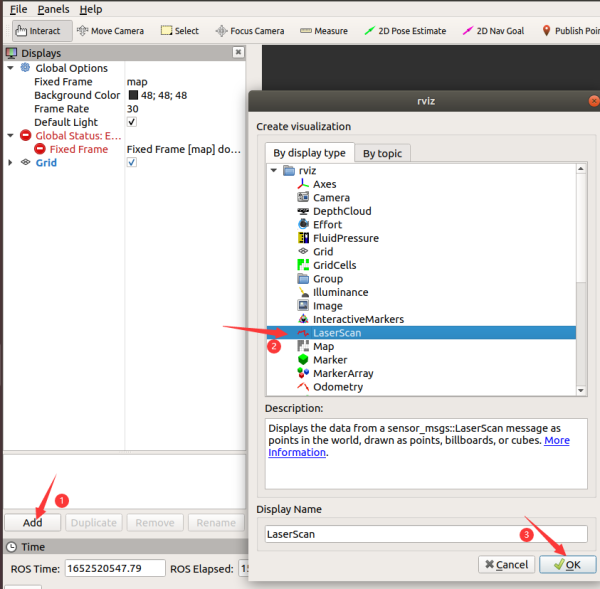
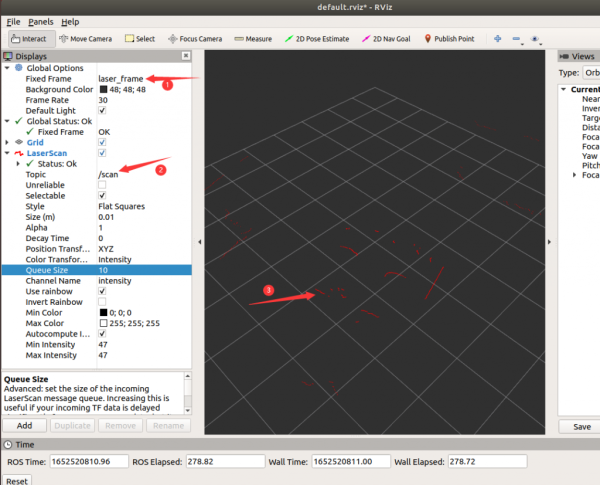
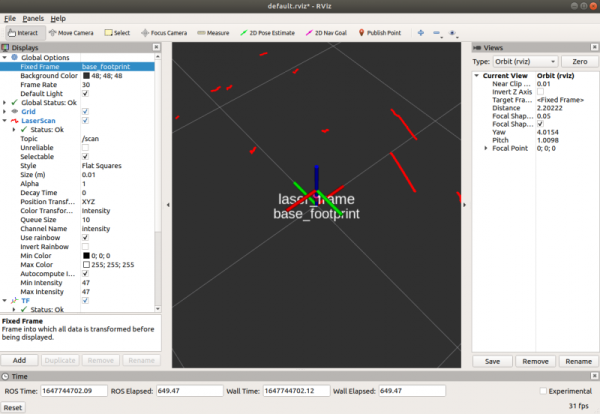
- Klicken Sie auf „Add“, um die Komponente LaserScan hinzuzufügen, wählen Sie das Thema /scan für das Thema und Laser_frame für den festen Rahmen, um die Radardaten zu sehen. Die roten Punkte im Bild sind die vom Radar gescannten Punkte.
- Klicken sie auf "Add" um dann die TF Komponente hinzuzufügen.
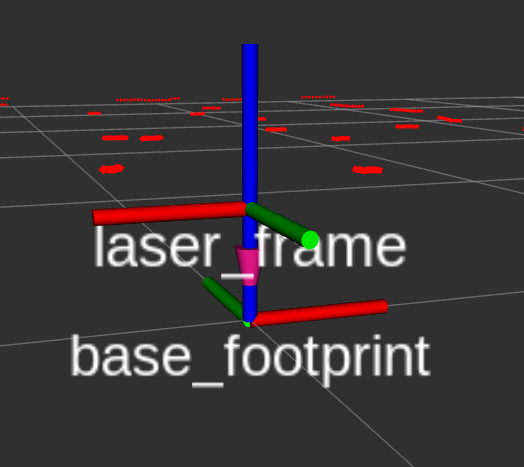
- TF zeigt zwei Koordinaten an, wobei base_footprint die Fahrgestellkoordinaten des Roboters sind und laser_frame die Radarkoordinaten. Die Radarkoordinaten und die Fahrgestellkoordinaten sind entgegengesetzt.
Daten analysieren
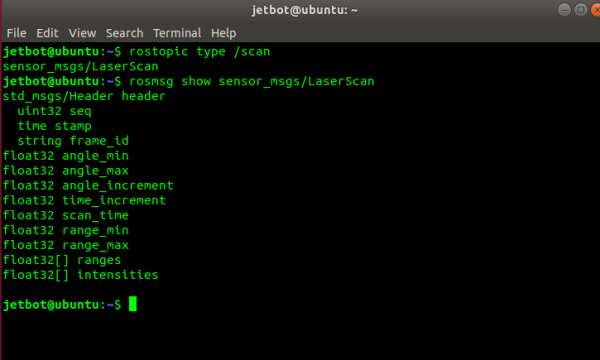
- Run the following command to view the data type of the radar topic /scan.
rostopic type /scan
- As shown in the figure above, the output type is sensor_msgs/LaserScan, you can enter the following command to view the detailed message structure of LaserScan.
rosmsg show sensor_msgs/LaserScan
- Among which:
std_msgs/Header header             # Header is also a structure, including seq, stamp, frame_id
uint32 seq                   # refers to the id that increases in scan order
time stamp                   # stamp contains the time to start the scan and the time difference from the start of the scan. Note that the scan starts counterclockwise from the front.
string frame_id                    # frame_id is the name of the scanned reference system, which is very important in ROS. The message will be bound to tf to read the data
float32 angle_min                  # The angle at which to start scanning (rad)
float32 angle_max                  # The angle at which to end the scan (rad)
float32 angle_increment            # The angle to increase with each scan (rad)
float32 time_increment             # measurement interval (second)
float32 scan_time                  # scan interval (second)
float32 range_min                  # Minimum distance (m)
float32 range_max                  # maximum distance (m)
float32[] ranges                   # distance array (m), the length of the array is equal to the scan angle divided by each increment of the angle
float32[] intensities              # device-dependent, intensity array, the same length as ranges
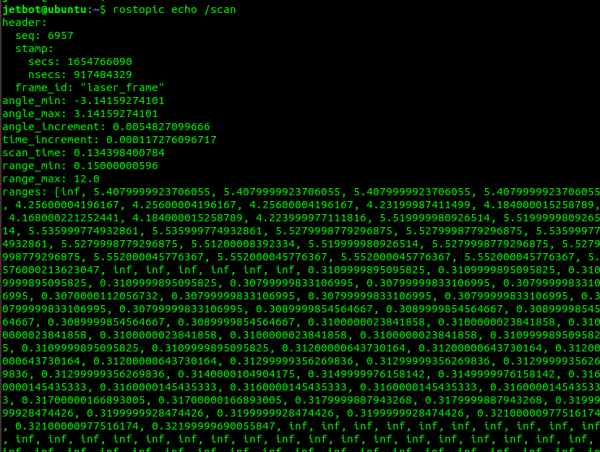
- Enter the following commands to view the data of the lidar topic "/scan".
rostopic echo /scan
- From the data, it can be found that the scanning angle is -3.14 ~ 3.14, that is, a circle of 360 degrees; the radar scanning distance range is 0.15m~12M. The ranges data is the distance data of each angle, and the length of the array is about (angle_max-angle_min)/angle_increment.
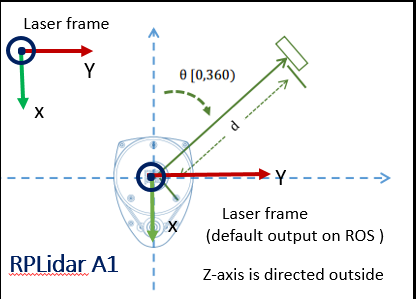
- The A1 radar angle is shown in the figure below. The first data angle of ranges is 0 degrees in the figure (that is, directly in front of the robot), and the last data is 360 degrees.
Daten filtern
- From the above steps, we know the data format and radar data information sent by the radar, so we can choose to filter the unwanted parts.
- [Note: Please close the radar node first, otherwise an error will occur if you start the radar node multiple times.]
- Enter the following command on the robot side to start the radar filter node.
roslaunch jetracer laser_filter.launch #Start the radar filter node
- Run the following command on the virtual machine side to open the RVIZ graphical tool interface.
rosrun rviz rviz
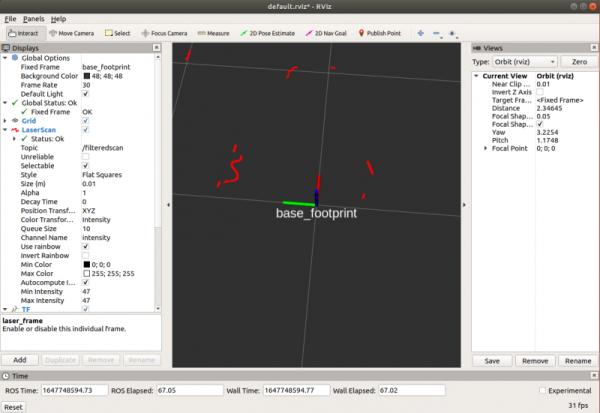
- Add LaserScan component, Topic select /filteredscan topic, Fixed Frame select base_footprint; add TF component to display the coordinates of the robot chassis; the red points in the image are the points scanned by the radar. At this time, it can be found that the radar data is only the first half, and the general data behind is filtered out.
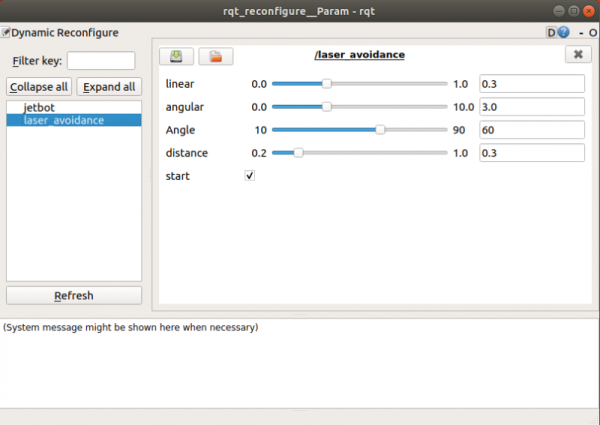
- Run the following commands to enable the reconfigure parameters interface.
rosrun rqt_reconfigure rqt_reconfigure
- Among which:
- laserAngle : Set the effective angle range to detect the angle in front of the robot
- distance: Set the effective distance, data beyond this distance will be filtered
- Drag the slider to adjust the parameters, and you can find that the red dot displayed by the radar also changes.
