Animated Gif mit Matlab erstellen: Unterschied zwischen den Versionen
Zur Navigation springen
Zur Suche springen
Keine Bearbeitungszusammenfassung |
Keine Bearbeitungszusammenfassung |
||
| (9 dazwischenliegende Versionen desselben Benutzers werden nicht angezeigt) | |||
| Zeile 1: | Zeile 1: | ||
'''Autor:''' [[Benutzer:Ulrich_Schneider|Prof. Ulrich Schneider]] | |||
[[Kategorie:MATLAB]] | |||
== Lektion: Animated Gif erstellen == | |||
In dieser Lektion lernen Sie, ein ''Animated Gif'' mit Matlab zu erstellen. | |||
'''Zeitumfang:''' 45 Minuten | |||
=== Aufgabe === | |||
* Simulieren Sie zyklisch einen variierenden Funktionsgrafen, der sich mit der Zeit verändert. | |||
* Speichern Sie die Einzelbilder in einer n-dimensionalen Matrix ab. | |||
* Speichern Sie diese Matrix als animierte Bilddatei <code>Animated.gif</code> ab. | |||
'''Tipp:''' verwenden Sie zum Zusammenfügen der Bilder <source lang="matlab" style="font-size:medium">imwrite(ImageData,map,filename,'gif','WriteMode','append')</source> | |||
=== [[Animated Gif mit Matlab erstellen|Musterlösung]] === | |||
=== Beispiel === | |||
[[Datei:AnimatedGif 01.gif]] | |||
== Lektion: [[Video aus Matlab Simulation erstellen | Video aus Simulation erstellen]] == | |||
== Geschützte p-Funktion erzeugen == | |||
Wenn man eine m-Funktion schützen möchte, so dass sie zwar verwendbar, jedoch nicht einsehbar ist, lässt sich diese mit einem Schritt in eine p-Funktion (''protected function'') umwandeln. | |||
<source lang="matlab" style="font-size:medium"> | |||
pcode(fun) | |||
</source> | |||
<source lang="matlab" style="font-size:medium"> | <source lang="matlab" style="font-size:medium"> | ||
x = 0:0.01:1; | x = 0:0.01:1; | ||
| Zeile 24: | Zeile 52: | ||
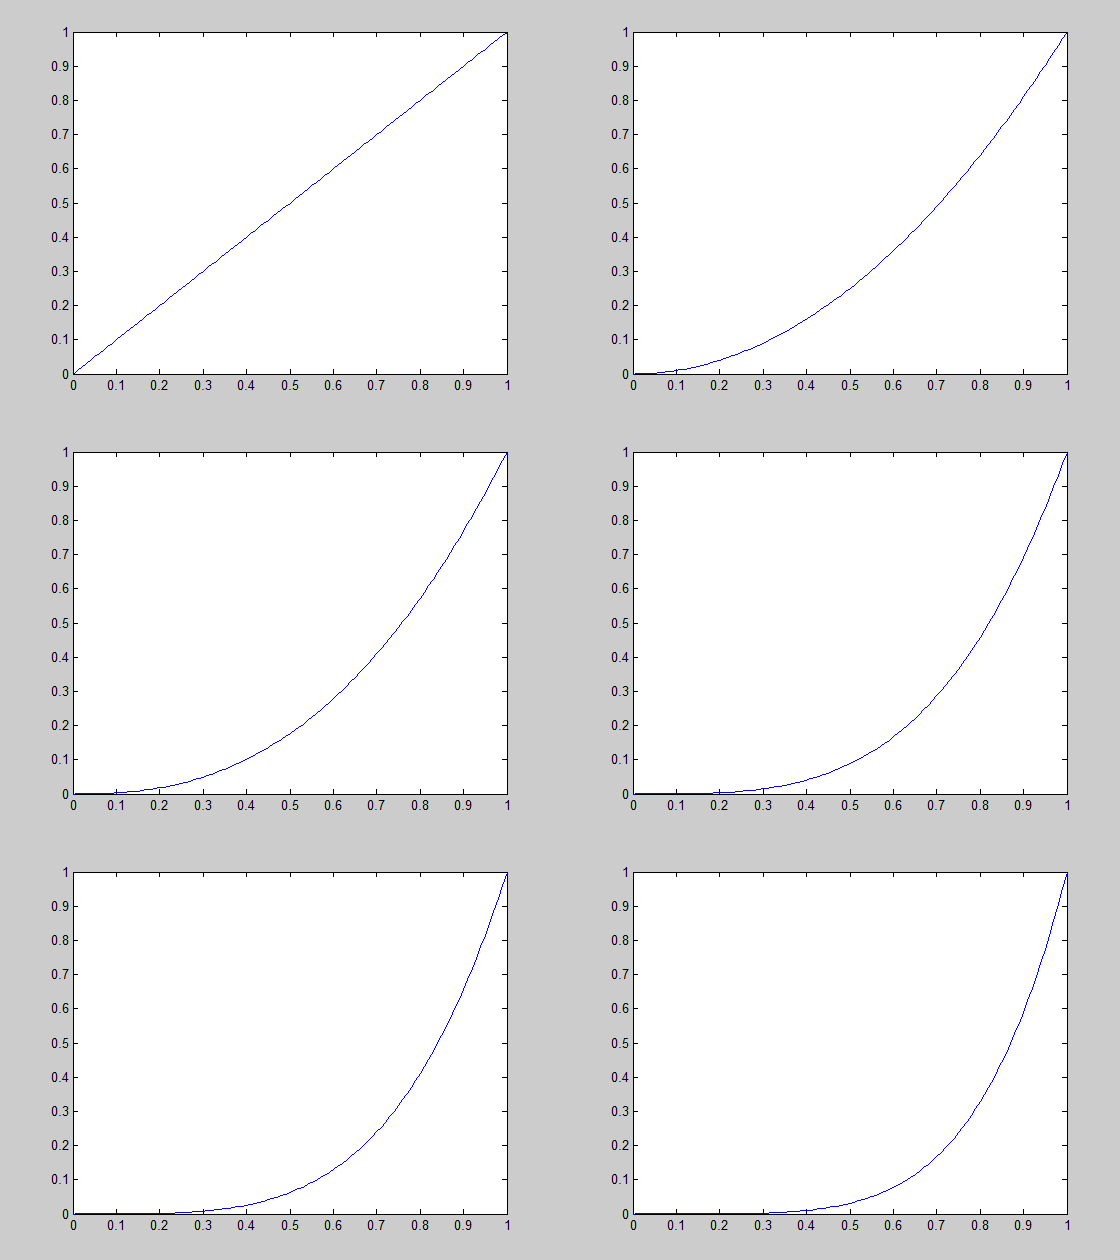
== Ergebnis == | == Ergebnis == | ||
[[Datei:AnimatedGif.gif]] | [[Datei:AnimatedGif.gif]] | ||
== Beispiel 2 == | |||
<source lang="matlab" style="font-size:medium"> | |||
Z = peaks; | |||
surf(Z) | |||
axis tight | |||
set(gca,'nextplot','replacechildren','visible','off') | |||
f = getframe; | |||
[im,map] = rgb2ind(f.cdata,256,'nodither'); | |||
im(1,1,1,20) = 0; | |||
for k = 1:20 | |||
surf(cos(2*pi*k/20)*Z,Z) | |||
f = getframe; | |||
im(:,:,1,k) = rgb2ind(f.cdata,map,'nodither'); | |||
end | |||
imwrite(im,map,'DancingPeaks.gif','DelayTime',0,'LoopCount',inf) | |||
</source> | |||
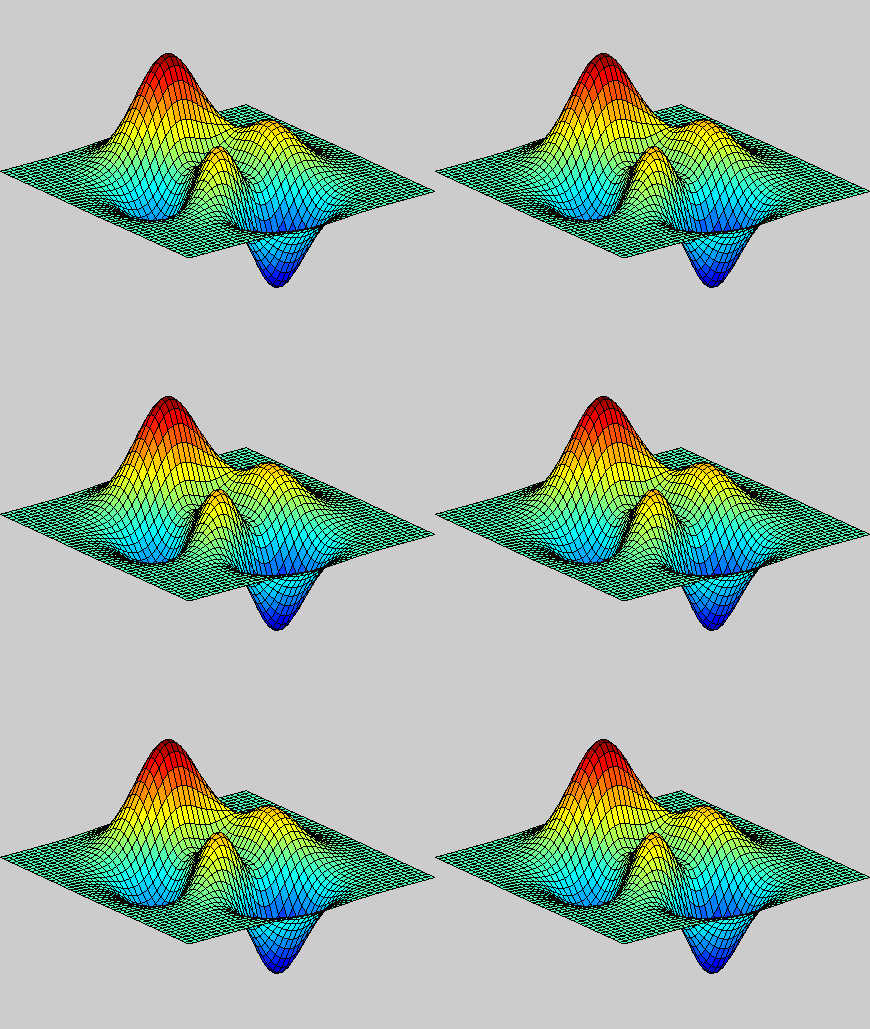
=== Ergebnis === | |||
[[Datei:DancingPeaks.gif]] | |||
[[Medium:AnimatedGif2.m]] | |||
<img vspace="5" hspace="5" src="AnimatedGif_01.png" alt=""> | |||
== Beispiel 3 == | |||
<source lang="matlab" style="font-size:medium"> | |||
x = 0:0.01:2*pi; | |||
omega = 0.5; | |||
k = 1; | |||
% Ausgabedatei | |||
outfile = 'sinewave.gif'; | |||
for t=1:50 | |||
plot(x, sin(omega*t + k*x), 'linewidth', 2, 'color', 'red'); | |||
ylim([-1 1]); | |||
xlim([0 2*pi]); | |||
grid on; | |||
% gif utilities | |||
set(gcf,'color','w'); % set figure background to white | |||
drawnow; | |||
frame = getframe(1); | |||
im = frame2im(frame); | |||
[imind,cm] = rgb2ind(im,256); | |||
% On the first loop, create the file. In subsequent loops, append. | |||
if t==1 | |||
imwrite(imind,cm,outfile,'gif','DelayTime',0,'loopcount',inf); | |||
else | |||
imwrite(imind,cm,outfile,'gif','DelayTime',0,'writemode','append'); | |||
end | |||
end | |||
</source> | |||
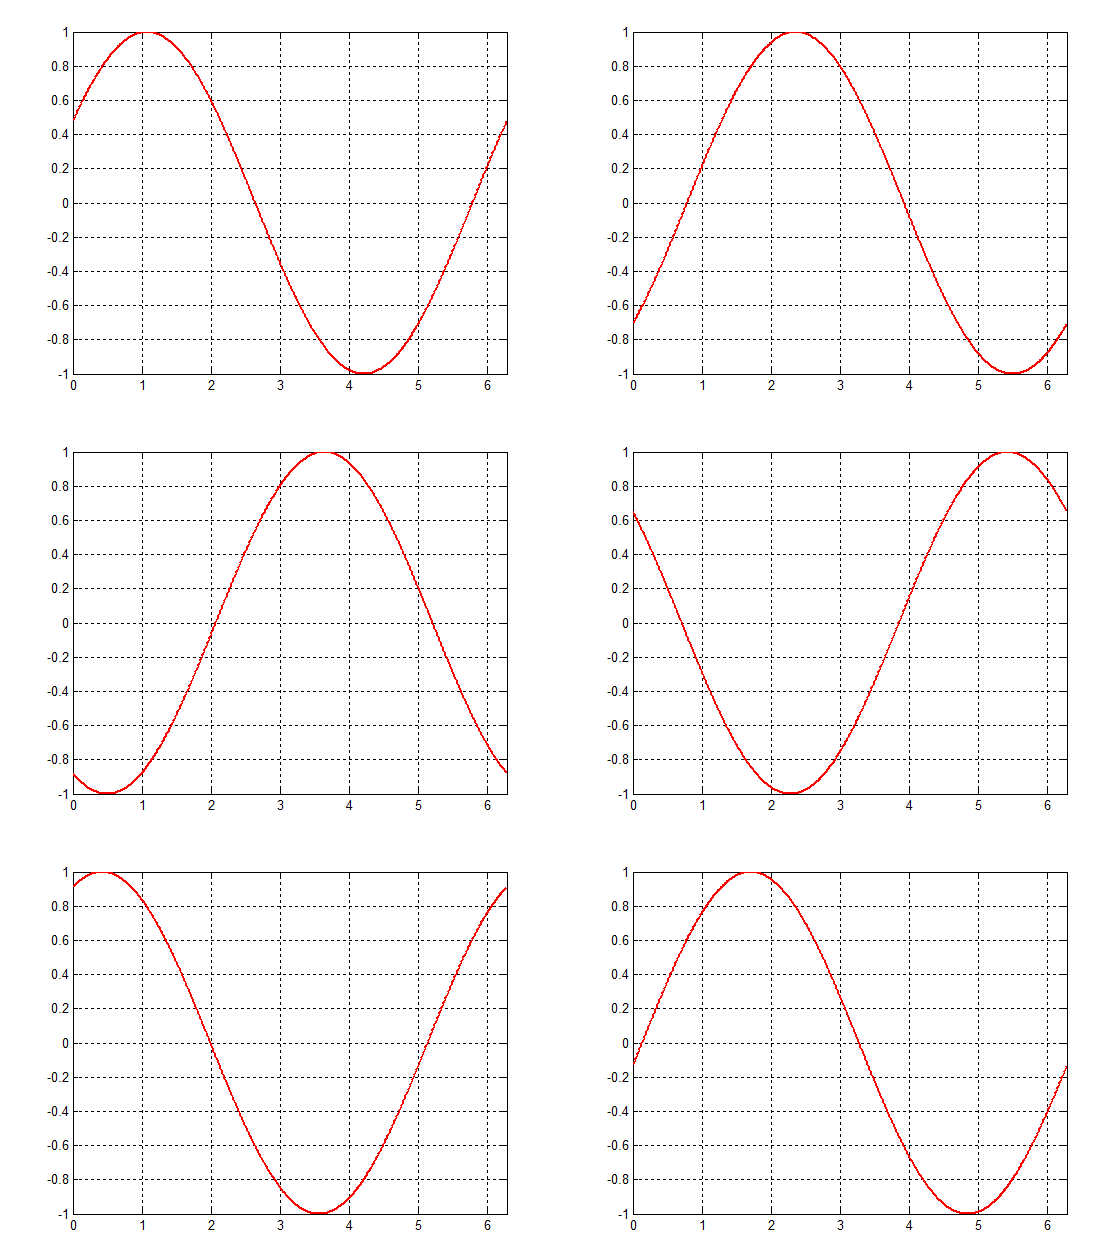
=== Ergebnis === | |||
[[Datei:sinewave.gif]] | |||
[[Medium:AnimatedGif4.m]] | |||
Quelle: [http://www.mathworks.com/matlabcentral/fileexchange/21944-animated-gif/content/Animated_GIF/html/AnimatedGif.html] | |||
---- | ---- | ||
→ zurück zum Hauptartikel: [[Einführung_in_MATLAB|Einführung in MATLAB]] | → zurück zum Hauptartikel: [[Einführung_in_MATLAB|Einführung in MATLAB]] | ||
Aktuelle Version vom 30. März 2021, 15:26 Uhr
Autor: Prof. Ulrich Schneider
Lektion: Animated Gif erstellen
In dieser Lektion lernen Sie, ein Animated Gif mit Matlab zu erstellen.
Zeitumfang: 45 Minuten
Aufgabe
- Simulieren Sie zyklisch einen variierenden Funktionsgrafen, der sich mit der Zeit verändert.
- Speichern Sie die Einzelbilder in einer n-dimensionalen Matrix ab.
- Speichern Sie diese Matrix als animierte Bilddatei
Animated.gifab.
Tipp: verwenden Sie zum Zusammenfügen der Bilder
imwrite(ImageData,map,filename,'gif','WriteMode','append')
Musterlösung
Beispiel
Lektion: Video aus Simulation erstellen
Geschützte p-Funktion erzeugen
Wenn man eine m-Funktion schützen möchte, so dass sie zwar verwendbar, jedoch nicht einsehbar ist, lässt sich diese mit einem Schritt in eine p-Funktion (protected function) umwandeln.
pcode(fun)
x = 0:0.01:1;
% Grafik erstellen
figure(1)
% Dateiname festlegen
filename = 'AnimatedGif.gif';
% 2 fps
for n = 1:0.5:5
      y = x.^n;
      plot(x,y)
      drawnow
      frame = getframe(1);
      im = frame2im(frame);
      [imind,cm] = rgb2ind(im,256);
      if n == 1;
          imwrite(imind,cm,filename,'gif', 'Loopcount',inf);
      else
          imwrite(imind,cm,filename,'gif','WriteMode','append');
      end
end
Ergebnis
Beispiel 2
Z = peaks;
surf(Z)
axis tight
set(gca,'nextplot','replacechildren','visible','off')
f = getframe;
[im,map] = rgb2ind(f.cdata,256,'nodither');
im(1,1,1,20) = 0;
for k = 1:20
  surf(cos(2*pi*k/20)*Z,Z)
  f = getframe;
  im(:,:,1,k) = rgb2ind(f.cdata,map,'nodither');
end
imwrite(im,map,'DancingPeaks.gif','DelayTime',0,'LoopCount',inf)
Ergebnis
<img vspace="5" hspace="5" src="AnimatedGif_01.png" alt="">
Beispiel 3
x = 0:0.01:2*pi;
omega = 0.5;
k = 1;
% Ausgabedatei
outfile = 'sinewave.gif';
for t=1:50

    plot(x, sin(omega*t + k*x), 'linewidth', 2, 'color', 'red');
    ylim([-1 1]);
    xlim([0 2*pi]);
    grid on;

    % gif utilities
    set(gcf,'color','w'); % set figure background to white
    drawnow;
    frame = getframe(1);
    im = frame2im(frame);
    [imind,cm] = rgb2ind(im,256);

    % On the first loop, create the file. In subsequent loops, append.
    if t==1
        imwrite(imind,cm,outfile,'gif','DelayTime',0,'loopcount',inf);
    else
        imwrite(imind,cm,outfile,'gif','DelayTime',0,'writemode','append');
    end
end
Ergebnis
Quelle: [1]
→ zurück zum Hauptartikel: Einführung in MATLAB


